Power Slope Index

See the trend
before you trade.

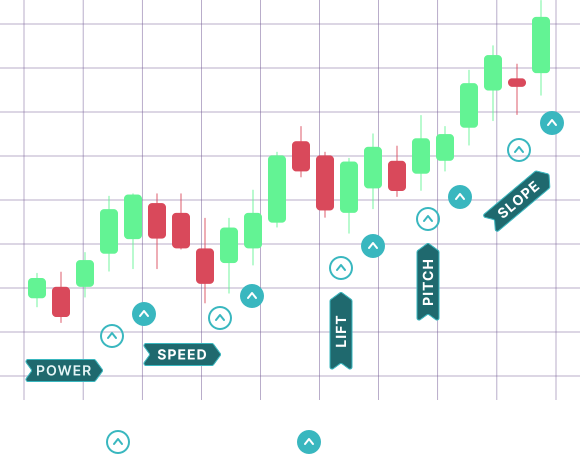
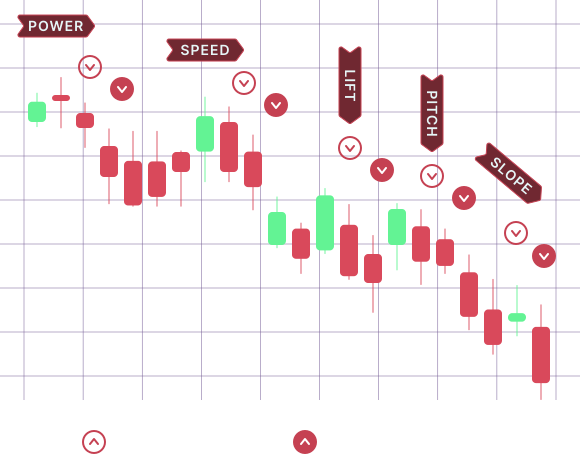
The PSI reads five nested market frames — POWER, SPEED, LIFT, PITCH and SLOPE — and condenses them into one score from −100 to +100. One glance tells you which way a market is moving, and how established the move is.

Before your next trade, check PSI first — instantly see whether market forces are working together, or against you.

3,000+symbols tracked
5market asset classes
$0Free Forever plan
NVDANVIDIA Corp.
As of Oct 8 close
+37
Developing uptrend
PSI COMPOSITE
POWER
−56
SPEED
−72
LIFT
−73
PITCH
+85
SLOPE
+90
Composite + five framesFull NVDA page →
Markets

PSI for popular symbols

END OF DAY · AS OF THU, OCT 8, 2026 CLOSE

The composite and all five frames, updated after each market close. Click any row for the full symbol page.

All markets →
SymbolCompositePOWERSPEEDLIFTPITCHSLOPETrend
NVDANVIDIA Corp. +37 −56 −72 −73 +85 +90 Developing uptrend
AAPLApple Inc. +70 +36 +49 +60 +63 +89 Established uptrend
MSFTMicrosoft Corp. +47 −41 −52 −36 +83 +93 Advancing uptrend
AMZNAmazon.com Inc. −20 −47 −51 −1 +39 −53 Emerging downtrend
TSLATesla Inc. +41 +14 −29 −40 +75 +72 Advancing uptrend
METAMeta Platforms +49 +5 −35 −62 +87 +95 Advancing uptrend
GOOGLAlphabet Inc. −2 −14 −10 +24 +51 −42 Emerging downtrend
AMDAdvanced Micro Devices +41 −63 −78 −76 +94 +96 Advancing uptrend
The power of a small edge

You don't need to predict every move.

Roger Federer won barely 54% of the points he played. Yet that small advantage produced 20 Grand Slam titles and more than 1,200 match victories.

The edge was small. Repeated thousands of times, it changed everything. Markets reward the same math: the best investors aren't right all the time, they're right often enough.

SIGNAPLEX helps you spot that edge before you place the trade.

Find your SIGNAPLEX edge
Track record

Proven results with SIGNAPLEX

Calculated with a deliberately conservative execution method that favors transparency over optimization.

2026 signals
SymbolSignalOpenCloseReturn
SNDKLIFTJan 05, 2026
285.00
May 01, 2026
1,048.00
+267.72%
AXTIPITCHFeb 06, 2026
24.15
May 01, 2026
78.20
+223.81%
INTCPITCHJan 07, 2026
44.57
May 01, 2026
92.61
+107.79%
GOOGLSPEEDMar 02, 2026
308.49
May 01, 2026
379.05
+22.87%
How these results are calculated. To keep results fair, transparent and reproducible, Signaplex tracks performance with deliberately conservative assumptions:
  • Entry price is the highest price of the signal day.
  • Exit price is the lowest price of the exit day.

This is the worst possible execution on both days and removes any benefit from timing or price optimization, so results reflect discipline, not hindsight.

Strategic alliances. Signaplex is backed by the world's leading technology startup programs.
  • Advancing trading intelligence with GPU-accelerated AI (NVIDIA).
  • Scale and performance with Azure-native infrastructure (Microsoft).
  • Scaling innovation through AWS cloud infrastructure and AI tooling.
NVIDIAMicrosoft for StartupsAWS

Past results shown for selected signals. Historical results do not guarantee future results.

Continuously validated market intelligence

Every signal must earn its place.

Signaplex does not rely on attractive charts or isolated winners. We test PSI signal hypotheses across broad historical samples, verify that results survive out-of-sample testing, and monitor every production signal as new market data arrives.

Latest validated development

PSI Flip to Green

The Composite PSI flips from negative to positive. Every position is monitored through a 10-day safety checkpoint that exits early if the Composite PSI signals a trend reversal, before the full holding period completes.

2,300+historical trades tested
1,212distinct symbols
2.81historical profit factor
33.07%annualized simulated return
95%statistical confidence threshold

For individual investors

Explore the PSI free forever, learn how market forces across five frames align, and use continuously tested intelligence to support more disciplined decisions.

Explore PSI Free Forever

For institutions & platforms

Hedge funds, trading platforms, brokers and financial applications can consume PSI intelligence through APIs, licensed data feeds and custom integrations.

Institutional PSI access

Historical and simulated results are presented for informational purposes only and do not represent actual trading results. Past performance does not guarantee future results. Trading and investing involve risk, including possible loss of principal.

How the PSI works

A trend is a relay, not a sprint.

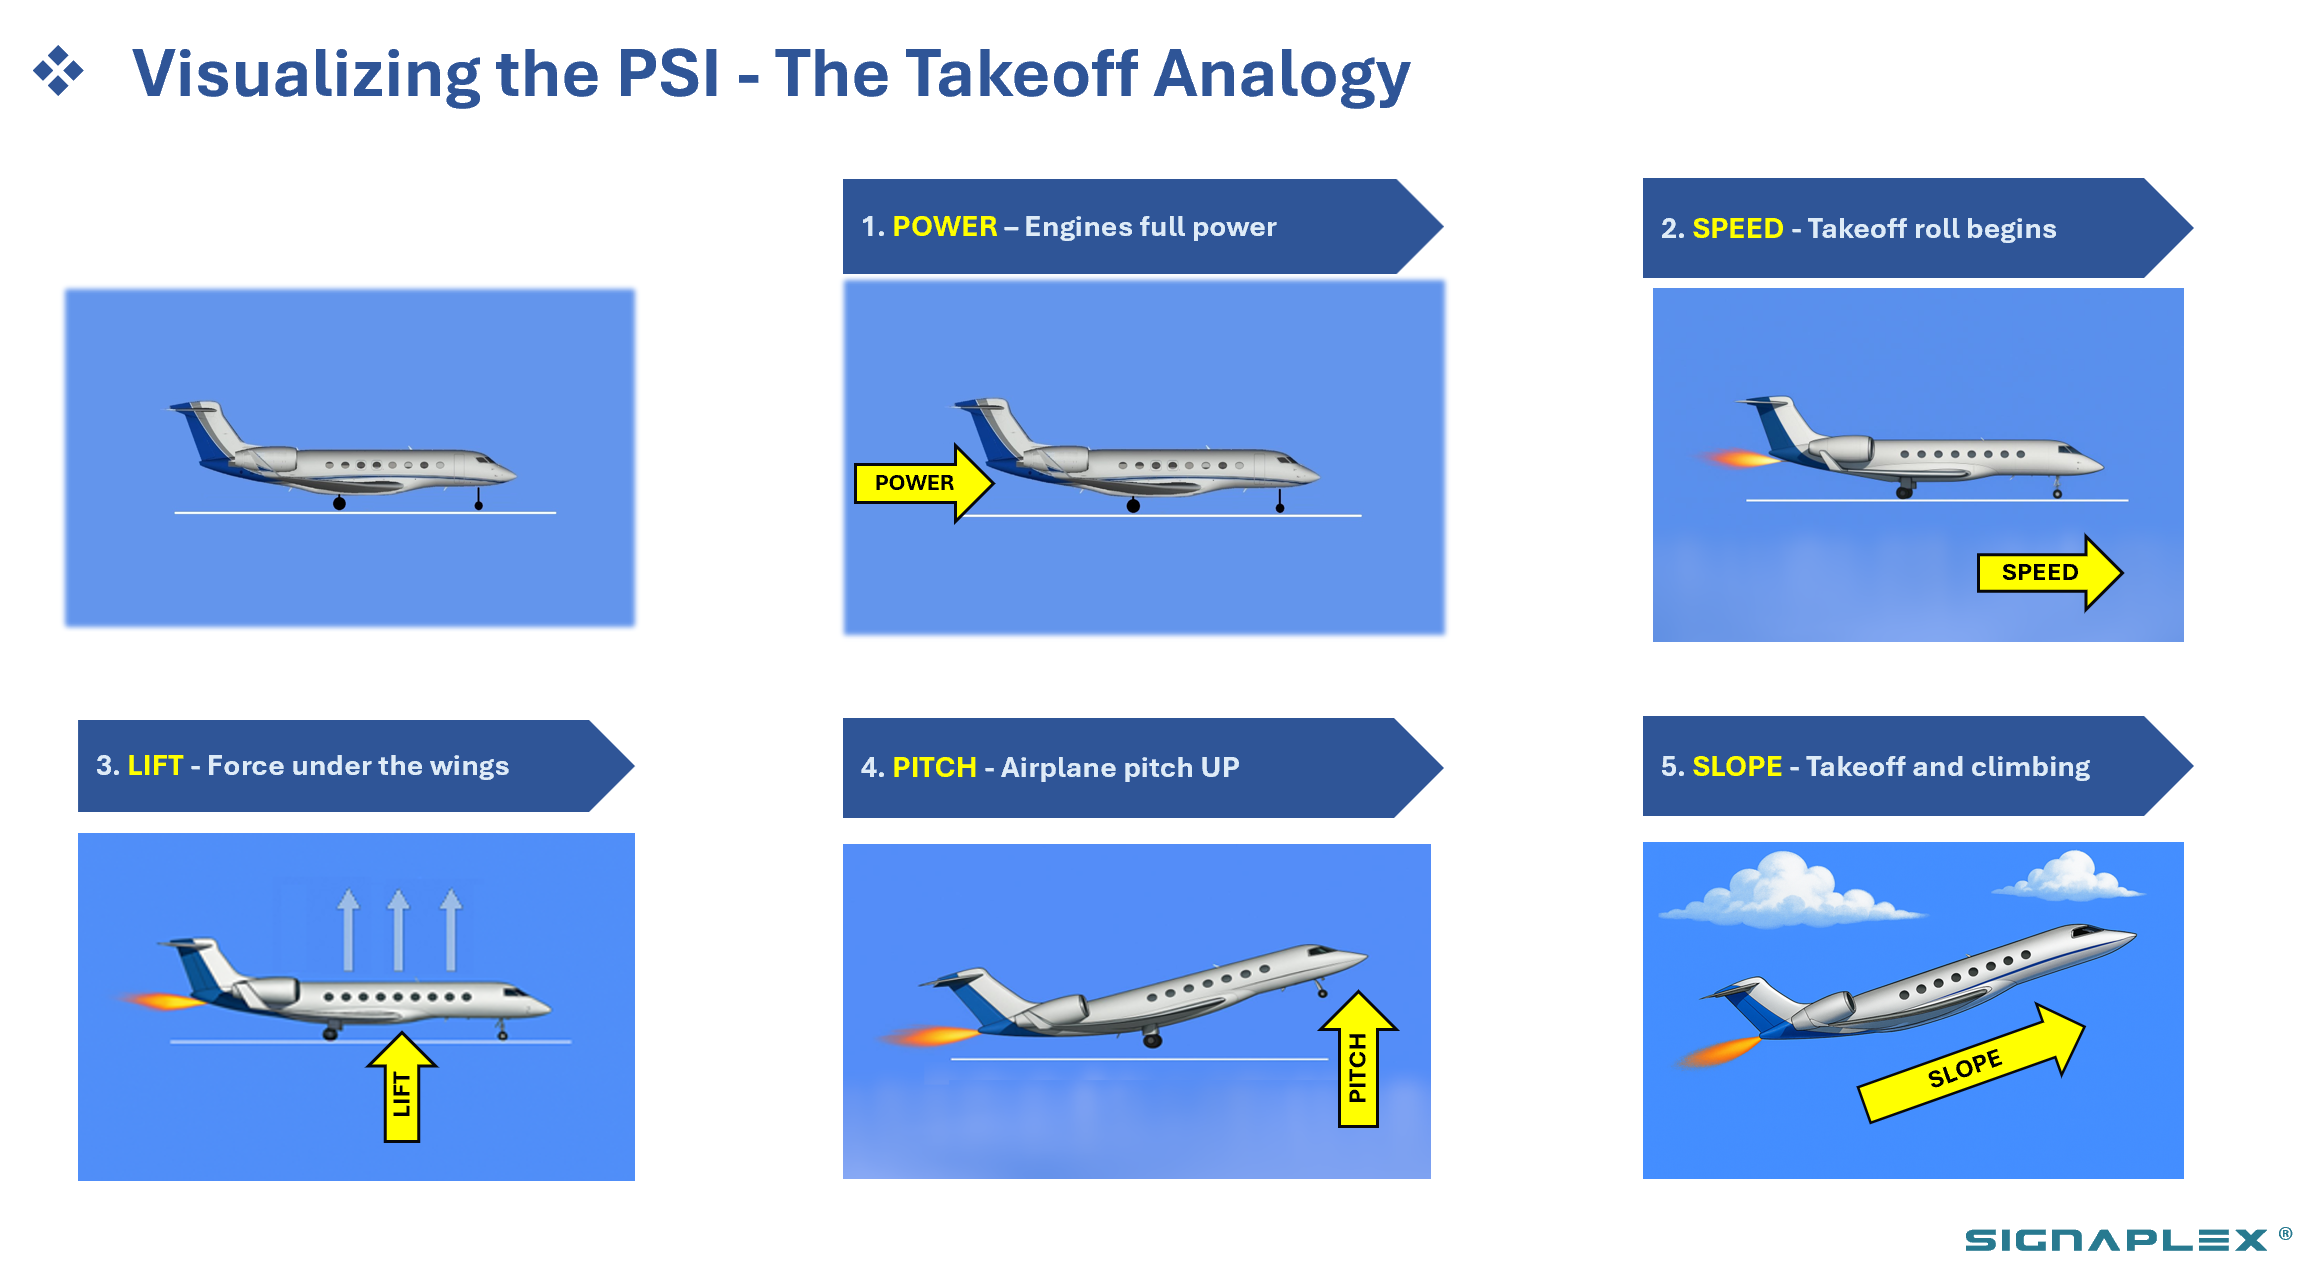
  1. POWER detects a potential trend change, providing the earliest initial alert.
  2. SPEED confirms the POWER signal, indicating an early trend has formed.
  3. LIFT identifies the start of a trend, following the SPEED signal.
  4. PITCH shows the trend is well established and continuing strongly.
  5. SLOPE indicates a stable, sustained trend: the final confirmation stage.
  6. One score sums it up. Each signal builds on the previous one, and the PSI Composite tells you direction and conviction on a −100 to +100 scale.

Watch the PSI Relay animation →

Inside the app

Everything you need to act on the trend.

See plans →
Takeoffs

Uptrend trading ideas

  • Fresh uptrend ideas every market session
  • Create your own custom signals with the Advanced Scanner
  • Five signal categories to fit your trading strategy
  • AI Analyst reports to help you evaluate opportunities
  • Signal alerts for the most popular crypto currencies, currency pairs, commodities, futures and indexes
Landings

Downtrend trading ideas

  • Fresh downtrend ideas every market session
  • Custom signals with the Advanced Scanner
  • Five signal categories to fit your short trading strategy
  • AI Analyst reports to help you evaluate short opportunities
  • Downtrend alerts for crypto, forex, commodities, futures and indexes
Trading alerts · 24 hours a day, 365 days a year

Never miss a signal change

  • Track favorite symbols in real time with My Alerts
  • Instant alerts on signal changes in My Watchlist
  • Portfolio performance alerts in My Portfolio
  • Stocks: real-time alerts for all five sequential signals during market hours
  • Crypto: round-the-clock monitoring, 365 days a year
  • Forex, commodities, futures and indexes: alerts across energy, metals, agriculture and the most popular indexes
Telegram Email Phone alerts via Telegram and email
Congress Watch

Track the trading activity of members of Congress

  • Filter by member name
  • See the exact trade dates and assets traded
  • Gain insight into the size of each transaction
SymbolTypeMemberDate
NVDAPURCHASECleo FieldsJun 26, 2026
METAPURCHASEJared MoskowitzJun 17, 2026
AMZNSALERo KhannaJun 05, 2026
AAPLSALEDan CrenshawJun 01, 2026
Pricing

Start free. Upgrade when you're ready.

Compare plans →
Free Forever
$0

Check the PSI of any symbol, one per minute.

Start free
Standard
$10/mo

Full app with up to 10 active symbols.

Choose Standard
Premium
$20/mo

Full app with up to 25 active symbols.

Choose Premium
Pro
$30/mo

Up to 3,000 symbols and AI Analyst reports on every stock.

Choose Pro

Paid plans include a 30-day free trial. Annual billing saves 16%.

FAQ

Frequently asked questions

Getting started
What is Signaplex?

Signaplex is a market-analytics platform built on the Power Slope Index (PSI), a proprietary trend indicator that reads price action across five nested market frames and condenses it into a single score from −100 to +100.

It covers US stocks plus Forex, Crypto, Indices and Futures, and turns PSI into ready-made idea lists (Takeoffs, Landings, Investment Zones, Scanner), real-time alerts, AI Analyst reports and portfolio tracking.

What plans are available and what do they cost?
Free Forever
$0
Check the PSI values of any symbol, once a minute.
Standard
$10/mo
Full app with up to 10 active symbols.
Premium
$20/mo
Full app with up to 25 active symbols.
Pro
$30/mo
Up to 3,000 symbols and AI Analyst reports on every stock.

Annual billing on paid plans saves 16%. On Standard and Premium, AI Analyst reports cover your active symbols; Pro unlocks them for the whole universe.

Is there a free trial?

Yes. Paid plans start with a 30-day free trial with full access. And if you only need a quick PSI read now and then, the Free Forever plan never expires.

Can I cancel anytime?

Yes. You can cancel at any time without penalties, including during the trial, in which case you are not billed.

Is Signaplex for beginners or experienced traders?

Both. Beginners can lean on the composite score, the dial and the ready-made idea lists; experienced traders can work the five individual frames, alerts and the Scanner.

The Power Slope Index
What is the Power Slope Index (PSI)?

PSI is a bounded directional score (−100…+100) built from trend-state alignment across five nested market frames, from fast movement to structural trend. It is not a calculus slope or an oscillator; it is a state-machine view of how coherent the trend is.

FrameWhat it tells you
POWERThe fastest pulse. First to turn, first to warn.
SPEEDConfirms whether POWER's turn has follow-through.
LIFTThe move is gaining altitude.
PITCHThe trend most swing trades ride.
SLOPEThe structural trend. Slowest to turn, hardest to fake.

The PSI Composite blends the five into one score. It is weighted, not averaged: the deeper frames (PITCH and SLOPE) carry more weight, so a move only scores high once it reaches the deeper frames.

Watch the animated lesson: how the PSI develops →

How do I read the composite score?

Every PSI page shows the composite on a dial with four zones around a neutral zero line:

STRONG DOWNTREND
DOWNTREND
UPTREND
STRONG UPTREND
−100−500 · neutral+50+100

Next to the dial, the magnitude gets a trend label. The same bands apply in both directions:

+81…+100Sustained uptrend
+61…+80Established uptrend
+41…+60Advancing uptrend
+21…+40Developing uptrend
+1…+20Emerging uptrend
−1…−20Emerging downtrend
−21…−40Developing downtrend
−41…−60Advancing downtrend
−61…−80Established downtrend
−81…−100Sustained downtrend
0 · Neutral / mixed: the frames disagree and the composite compresses toward zero.
What are sequential signals?

Trends don't appear in every frame at once; they hand off. A turn shows up in POWER, then SPEED, LIFT, PITCH and finally SLOPE. As each frame joins, conviction concentrates. Sequential signals track those hand-offs to spot timely entries, adds, exits and setups to avoid.

Power Slope principle Takeoff analogy

See it as a relay race. Each frame runs a longer leg than the one before and hands the move upward. Press Play, then try Dropped baton to see what happens when the fast frames roll over before the deeper frames confirm.

▶ Watch the PSI Relay
What makes the PSI different from other indicators?

Most indicators measure a single view of price and react to it. PSI reads five nested frames as states, scores how well they agree, and weights the deeper ones more. The result is one bounded number that says both which way and how established a trend is, with UP/DOWN crossover events marking fresh trend starts.

Signals & strategies
What are the most popular entry signals?
Flip to GreenThe composite crosses above zero while POWER is already positive. One signal per symbol every 60 days.
Trend AlignmentAll five frames turn positive together: the full sequence is in place.
Trend PullbackPITCH and SLOPE stay up while POWER and SPEED dip. Entry when POWER turns back up.

You'll find them in Signals → Takeoffs and the Scanner, and the AI Analyst report flags them per symbol.

Watch the animated lesson: the 3 entry signals →

How have the signals performed in backtests?

Flip to Green, held for a fixed 80 days:

~32.7%
Annualized return
870
Trades tested
5.56
Z-score
60 d
Cooldown per symbol
StrategyAnnualizedWin rateZ-score
Flip to Green · 80-day hold~32.7%—5.56
Flip to Green · exit on first profit, 70-day capExit at next open after the first profitable close, otherwise at day 70~47.7%87.8%—
SLOPE Flip + POWER divergence · 60-day hold~28%—6.29

A Z-score above 3 means results that strong would be very unlikely to occur by chance.

Hypothetical, simulated results from historical data. They do not represent actual trading, may not reflect all costs such as commissions and slippage, and past performance does not guarantee future results.

How do I use the PSI in my trading? (decision guide)
SetupFramesCompositeActionInvalidation
Flip to Greenfresh longPOWER already positiveCrosses above 0Enter on the crossComposite falls back below 0
Trend PullbackpullbackPITCH, SLOPE up; POWER, SPEED dip≥ 0 or stabilizingEnter when POWER turns back upPITCH flips negative or composite keeps falling
Trend Alignmentfull sequenceAll five positiveRisingEnter or size up while alignment holdsReverts to mixed, composite drifts to 0
Momentum add-onAll positive, sequence intactRisingAdd on shallow pauses; trail the stopPOWER turns negative or composite stalls
POWER-flip exitprotect gainsPOWER turns negative and lingersRolling overTighten stops or scale out; escalate if SPEED followsPOWER quickly re-aligns positive
Aligned breakdownshortAll five negativeBelow 0 and fallingShort the first full alignmentReverts to mixed or composite drifts to 0
Counter-trend cautionDeep frames negative; POWER bounces≤ 0 or slight +Avoid longs; short if POWER rolls over with SPEEDFrames re-align positive
Chop filterMixed, no alignmentNear 0Reduce size or waitAct only on fresh alignment

Educational framework, not a recommendation to transact in any security.

Using the app
Where do I find things in the app?
SectionWhat's inside
TodayYour overview with the PSI of your focus symbols.
SignalsTakeoffs (uptrend ideas), Landings (downtrend ideas), Investment Zones and the Scanner.
My DeskMy Symbols, Alerts, Watchlists and Portfolios.
MarketsSentiment, Movers, the earnings Calendar and US Congress trades.
PerformanceHistorical signal performance and simulations.
AcademyAnimated lessons, tutorial videos and the full reference.

Use the search box at the top to open any symbol's PSI page, Chart, AI Report and Fundamentals. Switch asset class (Stocks, Forex, Crypto, Index, Futures) from the top bar.

How do alerts work?

In My Desk → Alerts, add a symbol and switch on Up and/or Down for the PSI composite or any of the five frames. When a switched-on signal changes direction, you get an email right away.

Alerts are available for stocks, Forex, Crypto, Indices and Futures.

Watch the animated lesson: set up My Alerts →

How often is the PSI updated?

Continuously, as each new bar closes: during market hours for stocks, indices and futures, and 24/7 for crypto and forex. Alerts fire in real time on direction changes.

What are Takeoffs and Landings?

Takeoffs are stocks where an uptrend is starting or building, such as Flip to Green signals. Landings are the mirror image: stocks rolling into a downtrend. Both lists refresh with the market and link straight into each symbol's PSI page.

Does Signaplex use AI?

Yes. The AI Analyst writes a report per symbol that puts its PSI state in context: the active pattern (Flip to Green, Trend Alignment, Trend Pullback), scenarios, estimated price action and risk factors.

Can I track a portfolio?

Yes. My Desk → Portfolios tracks positions with shares and cost, live value and gain, alongside the full PSI read of every holding. Watchlists do the same without positions.

How does US Congress trade tracking work?

Markets → US Congress lists disclosed trades by members of Congress, so you can see what they trade and check each symbol's PSI.

Are there learning resources?

Yes. Tutorials has the intro video and three animated lessons: How the PSI develops, Set up My Alerts and The 3 entry signals.

For trading platforms
Can I add the PSI to my trading platform?

Yes. Brokers and trading platforms can embed the PSI Widget in their own applications, giving their users the composite score, the five frames and the dial right next to their charts.

Get in touch to discuss deployment:

Contact Signaplex →
Join our community

Check the PSI before your next trade.

SIGNAPLEX gives its community cutting-edge tools designed to support every member's investment goals. Join today: Free Forever, no card required.

Get started free